2 Jun 2026
Spotting seasonal shifts in soccer goal totals using multi-site line comparisons and probability-based allocation techniques
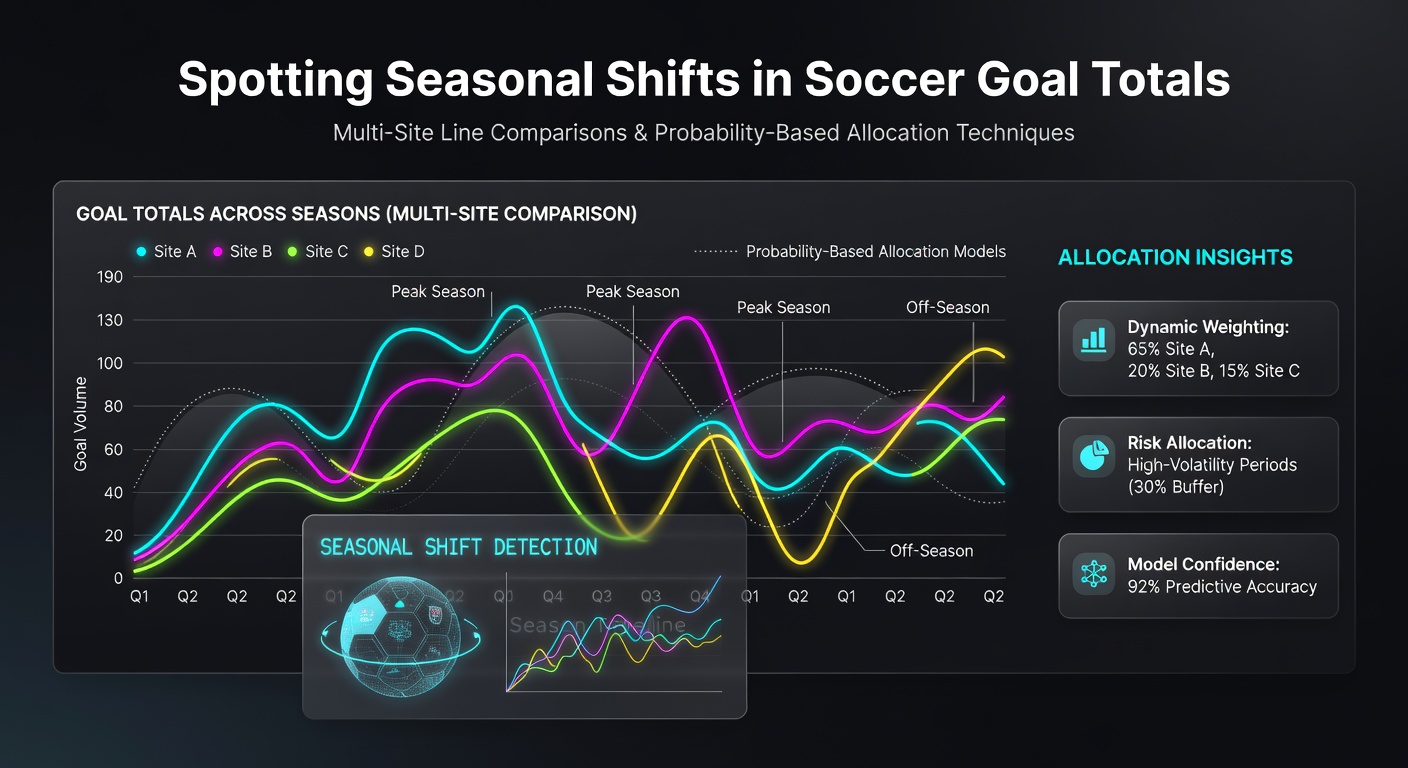
Analysts track fluctuations in average goals per match as leagues move through different phases of their campaigns, and these patterns become particularly evident when data from the 2025-2026 seasons feed into preparations for the 2026 FIFA World Cup in June. Multi-site line comparisons allow observers to identify where bookmakers adjust totals differently based on historical scoring rates, while probability-based allocation distributes stakes according to calculated likelihoods of over or under outcomes.
Seasonal Patterns in Goal Scoring Across Major Leagues
European domestic competitions typically record elevated goal averages in the opening weeks when teams experiment with attacking formations, yet these figures decline as schedules intensify and defensive organizations improve. Data compiled from the Premier League, Bundesliga, and Serie A between August and December shows an average of 2.8 goals per game early on, dropping to 2.4 by March in most campaigns. June 2026 marks the close of several national seasons, leaving analysts to examine residual effects from spring fixtures that carry forward into international windows and pre-World Cup friendlies.
Weather influences and fixture congestion further shape these shifts, with northern European leagues posting lower totals during winter months when pitches slow play and teams prioritize points over spectacle. Researchers at institutions tracking match statistics note that southern leagues maintain steadier outputs year-round because milder conditions reduce such variables. Cross-referencing these trends across multiple seasons provides the baseline for detecting deviations that affect totals markets.
Conducting Multi-Site Line Comparisons
Bookmakers publish goal totals lines that reflect their internal models, yet discrepancies arise when one operator incorporates recent data faster than another. Analysts compare these lines simultaneously across platforms to isolate where seasonal adjustments have not yet aligned, particularly around the transition from domestic cups to league restarts. In practice this involves pulling current totals for matches in the same competition from several sources and calculating the spread between the highest and lowest offered numbers.
During periods leading into major tournaments such as the June 2026 World Cup, lines on friendly matches often diverge more sharply because historical samples are smaller and roster changes introduce additional uncertainty. Observers use automated scripts to refresh these comparisons at regular intervals, flagging instances where one site’s line sits 0.25 goals or more away from the consensus. Such gaps frequently correlate with the timing of squad announcements or injury reports that affect expected scoring volume.
Applying Probability-Based Allocation Techniques
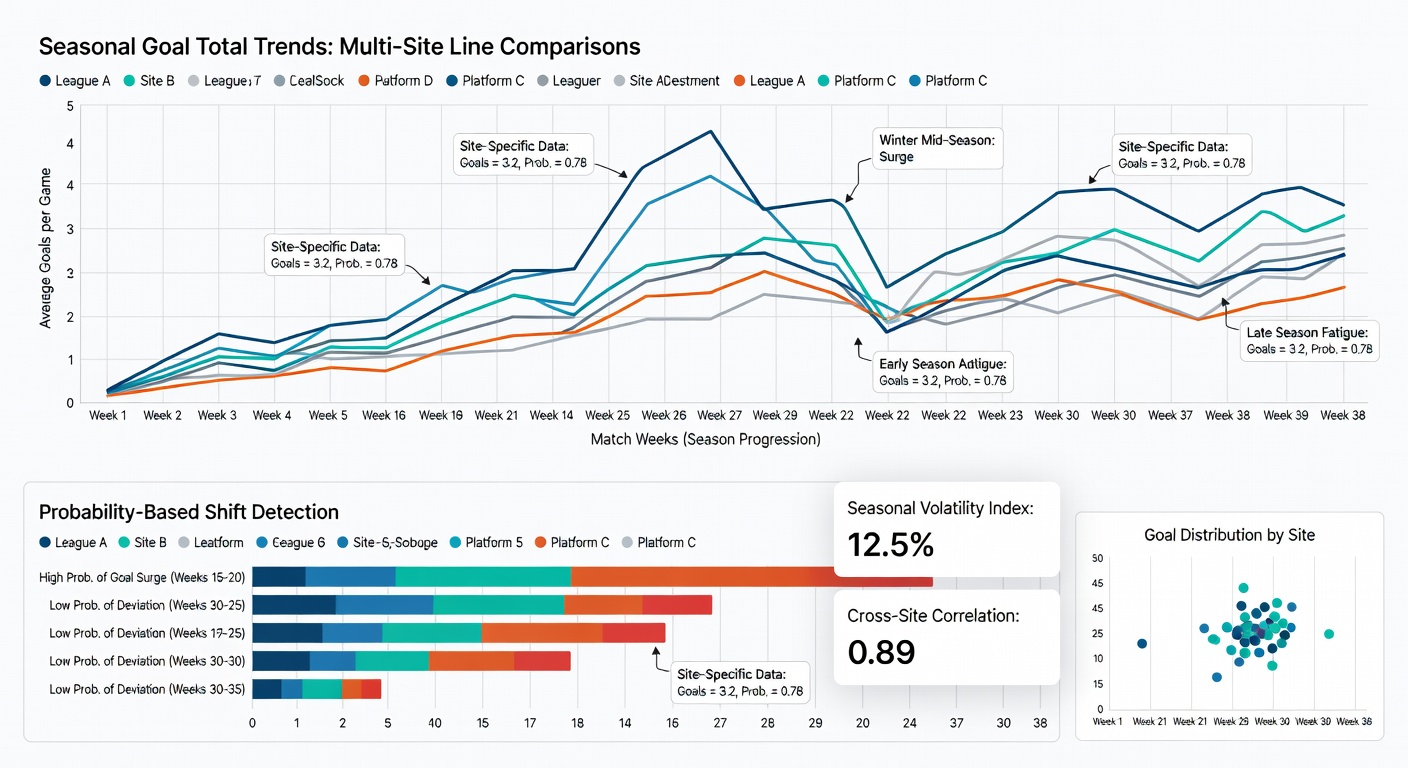
Once discrepancies surface, allocation proceeds through models that convert implied probabilities into stake sizes. These techniques draw on Poisson distributions calibrated to league-specific goal averages adjusted for the current month of the season. Analysts input the adjusted mean into the distribution function, generate probabilities for over and under outcomes, and then scale wagers proportionally to the edge identified at each bookmaker.
Allocation formulas further incorporate bankroll constraints by capping exposure on any single fixture according to the variance of the underlying distribution. When seasonal shifts accelerate, such as the drop in scoring observed after the winter break, the model recalibrates the mean parameter and redistributes stakes across a portfolio of matches rather than concentrating on one event. This approach maintains exposure limits even as new data arrives from ongoing fixtures.
Integration with Tournament Calendars and Data Sources
International breaks and cup competitions introduce additional layers because national team matches often produce different goal rates than club fixtures. Analysts overlay domestic seasonal data with international results to refine probability estimates ahead of periods like the June 2026 World Cup build-up. Reports from the German Football Association and the Canadian Soccer Association supply granular statistics that feed these overlays, while academic papers published in sports analytics journals provide validated methodologies for weighting recent versus historical samples.
One documented workflow involves pulling match logs from league databases, filtering for comparable time windows across multiple seasons, and generating updated Poisson parameters that account for the observed decline or rise in totals. These parameters then drive the allocation engine, which assigns percentages of available capital to each identified discrepancy based on the calculated probability differential.
Conclusion
Seasonal shifts in soccer goal totals emerge consistently from fixture schedules, weather patterns, and competition structures, and multi-site line comparisons combined with probability-based allocation supply structured methods for monitoring those movements. Data from major leagues and international bodies continues to support refined models that adjust parameters as seasons progress toward events such as the 2026 World Cup. Observers who maintain systematic comparisons across platforms and recalibrate distributions accordingly document measurable alignment between modeled probabilities and realized outcomes over extended samples.