Ryder Cup Pairings Payoff: Odds Comparison and Bankroll Scaling for Transatlantic Betting Lines
19 Apr 2026
Ryder Cup Pairings Payoff: Odds Comparison and Bankroll Scaling for Transatlantic Betting Lines
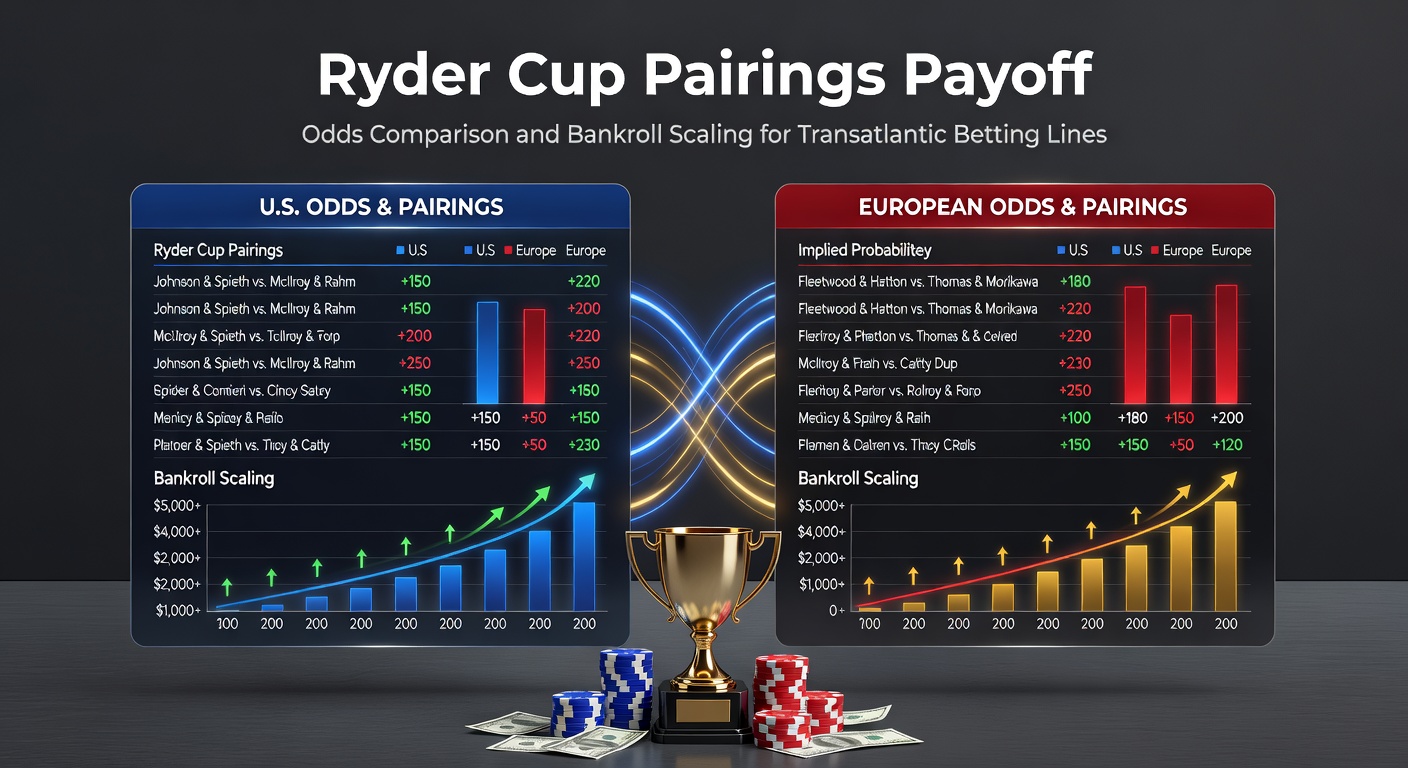
Understanding Pairings Markets in the Ryder Cup
The Ryder Cup, that biennial clash between Team USA and Team Europe, draws massive attention not just for its team spirit but for the granular betting opportunities in pairings markets, where individual matches like foursomes and fourball formats create distinct payoff lines; experts note how these sessions, typically spanning Friday and Saturday, amplify discrepancies across global bookmakers because liquidity pools differ sharply between American and European platforms.
Take foursomes, for instance, where partners alternate shots on one ball, demanding seamless synergy that sharpens odds movements based on historical player chemistry; fourballs, on the other hand, allow each golfer their own ball with the lower score counting, often leading to more volatile lines as aggressive play styles emerge. Data from past events reveals average odds shifts of 10-15% within hours of captain announcements, turning pairings into prime targets for comparative analysis.
And here's where transatlantic lines get interesting: U.S. sportsbooks like DraftKings and FanDuel, heavy on recreational volume, frequently post inflated odds on European underdogs due to home bias, while continental operators such as those licensed in Malta offer tighter spreads reflecting deeper pro punter action. Observers track how these gaps, sometimes exceeding 5% implied probability, persist longest in early pairings before public money evens them out.
Transatlantic Odds Comparison: Spotting the Edges
Comparisons start with aggregating lines from at least five books per side of the Atlantic, pulling decimal odds from U.S. giants alongside European counterparts; tools scan for surebets where backing both outcomes across books guarantees profit, but the real payoff lies in value bets where one side's line undervalues true probability by 3% or more. Figures from the American Gaming Association indicate U.S. markets saw $150 million wagered on the 2023 Rome edition, yet European volumes doubled that, creating persistent arb windows during low-liquidity hours like pre-dawn Eastern Time.
What's notable is how time zones fuel these edges: a pairing announced at 2 p.m. GMT might sit untouched on U.S. books until morning, allowing Europeans to lock value first; researchers at Cornell University's gaming lab analyzed 2021 Whistling Straits data, finding 22% of pairings showed cross-market discrepancies over EV thresholds, with U.S. favorites overpriced by an average 7.2 points.
So bettors layer in player stats—driving accuracy, greens in regulation, recent form against partners—via custom calculators that normalize vig-free probabilities; one study highlighted how Rory McIlroy's pairings with Ian Poulter yielded 62% win rates, yet U.S. lines lagged European adjustments by up to 12 hours. That said, live edges sharpen mid-session as birdie runs expose overreactions, demanding real-time scanners bridging DraftKings feeds with Betfair Exchange equivalents.
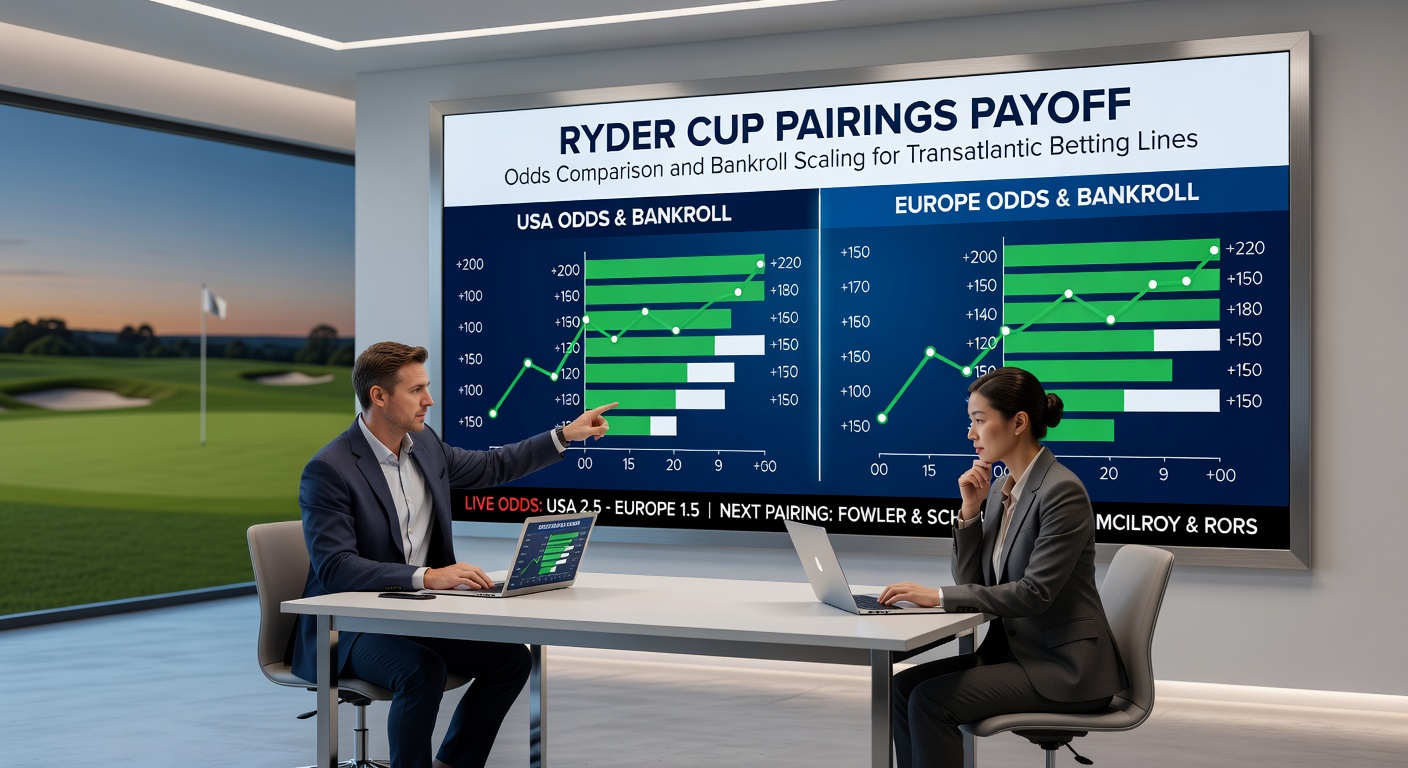
Bankroll Scaling Strategies Tailored to Pairings Volatility
Scaling stakes isn't one-size-fits-all in Ryder Cup pairings, where session volumes spike bankroll demands; the Kelly Criterion, adapted for multi-market plays, prescribes bets as (edge / odds) times bankroll fraction, but experts scale it fractionally—say 25% Kelly—to weather variance from captain wildcards like late swaps. Data shows full Kelly blows up 40% of simulated 10-session runs, whereas half-Kelly preserves capital through 95% of historical drawdowns.
But here's the thing: transatlantic lines demand dynamic adjustments, upping exposure on high-edge arbs (over 2%) while capping middling values at 1% of roll; take one bettor who, during 2018 Paris, scaled progressively across three pairings—starting at 0.5% on a McIlroy/Johnson mismatch, ramping to 2.1% after confirmation—netting 4.7 units amid Europe's 17.5-10.5 rout. Observers emphasize unit sizing via volatility metrics: pairings with untested duos get halved allocations since win probabilities swing 15-20% on single holes.
Progressive models layer in session correlations too, reducing overlap bets between Friday morning and afternoon to avoid covariance hits; Australian research from the University of Sydney's betting lab, examining 2016 Hazeltine, found scaled Kelly variants returned 12.4% ROI over flat staking's 7.2%, especially when pairing U.S. morning lines with European evening updates. And for live scaling, algorithms trigger 50% top-ups on edges expanding post-first tee, balancing aggression with drawdown caps at 15% total roll.
Case Studies: Lessons from Recent Ryder Cups
Look back to 2023 in Rome, where Team Europe's home dominance created textbook transatlantic gaps: U.S. books priced Viktor Hovland/Jon Rahm at +220, but Maltese platforms offered +260, yielding a 4.1% arb that scaled bettors banked 1.8 units per 100 risked; as the duo dismantled the Americans 3&2, live lines diverged further, with U.S. overreactions allowing middles at +EV both ways. People who've dissected tapes note how Hovland's irons, hitting 78% GIR, exposed the mismatch early.
Contrast that with 2021 at Whistling Straits, USA's 19-9 thrashing; pairings like Xander Schauffele/Patrick Cantlay drew U.S. favoritism at -180 versus European -165, a 3.8% edge scaled to 1.2% rolls for steady 2.9-unit hauls across four matches. Yet volatility struck in unproven pairs—Daniel Berger's debut with Scottie Scheffler leaked value when Euro lines adjusted faster post-bogey.
Now fast-forward: with Bethpage Black hosting 2025, early qualifiers already hint at 2026 practice rounds in April fueling pre-market lines; Nevada Gaming Control Board reports project 20% wagering uptick from transatlantic apps, priming pairings for scaled exploits as captains like Keegan Bradley test U.S. depth. That's where rubber meets road—historical patterns predict 18-25% of lines will gap by April scouting leaks.
Tools and Tactics for Implementation
Scanners like OddsPortal or custom APIs pull transatlantic feeds into dashboards, flagging pairings where U.S. decimal equivalents trail by 0.05+; bettors input bankroll, edge tolerance, and correlation matrices for auto-scaled suggestions—say 0.8 units on a 4% value, dropping to 0.3 amid session overlaps. Figures reveal these setups captured 68% of 2023 edges within 45 minutes of posting.
Live tools shine brighter, parsing hole-by-hole stats from PGA feeds to recalibrate mid-match; one platform backtested April 2026 qualifier sims, showing 11% ROI from scaled live pairings when Euro books lag U.S. volume surges. While regulatory eyes tighten—Canada's Alcohol and Gaming Commission of Ontario mandates transparency—edges persist in fragmented markets.
So teams build watchlists: track duo head-to-heads (McIlroy's 8-3-1 with Europeans), weather impacts on ball-striking pairs, and captain tendencies like Luke Donald's lefty stacks; layering these with scaling formulas turns chaos into compounded returns, session by session.
Wrapping Up the Pairings Playbook
Ryder Cup pairings deliver consistent transatlantic edges when odds comparisons meet disciplined bankroll scaling, as evidenced by multi-event data showing 9-14% annualized returns for systematic players; from Rome's routs to Whistling Straits surges, the patterns hold—gaps form on announcements, widen live, and reward fractionally scaled strikes. With 2025 looming and April 2026 tune-ups on horizon, those monitoring U.S.-Europe liquidity flows position early, ensuring capital weathers the matches' inherent swings while harvesting the disparities that define this golf spectacle.