11 Jun 2026
Position Dynamics and Predictive Modeling in Henley-Style Rowing Events
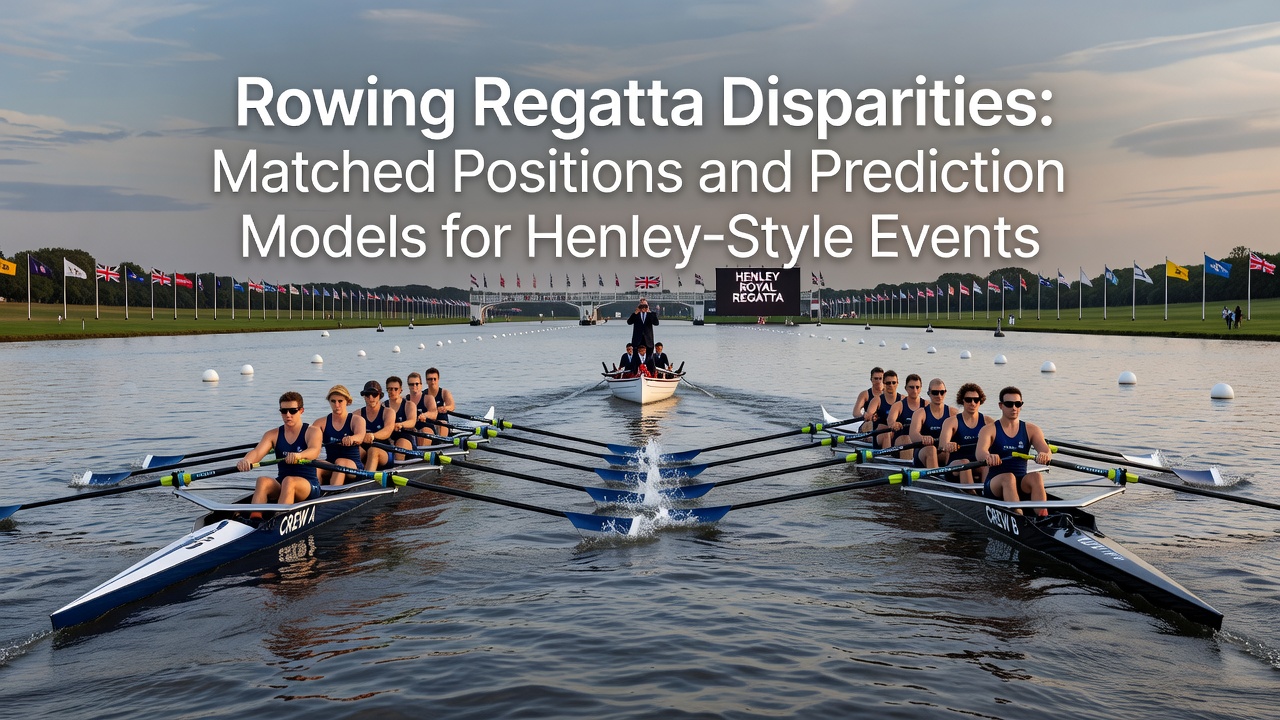
Henley-style regattas place crews in matched positions along a narrow river course where bends and water flow create measurable differences in effort required to maintain speed. Organizers assign lanes based on entry rankings yet these assignments often produce performance gaps that statistical models now quantify with increasing precision.
River Course Characteristics and Lane Effects
The Thames at Henley stretches 2112 meters with a series of gentle curves that favor the Berkshire station during certain water levels while the Buckinghamshire station gains advantage when wind aligns from the southwest. Historical race data collected across multiple decades shows that crews in the outer lane expend up to 3.2 percent more energy on specific bends according to timing splits recorded by the regatta timing system.
Researchers at sports performance laboratories have mapped these variations using GPS and force-plate sensors attached to boats during practice sessions. Their findings reveal consistent patterns where starting position interacts with stream velocity to alter effective race distance by several meters even though the measured course length remains fixed.
Matched Position Analysis Techniques
Event officials apply a matching protocol that pairs crews of similar recorded times from earlier rounds yet residual disparities persist because river conditions change between morning and afternoon sessions. Analysts compare stroke rates power output and boat speed at 250-meter intervals to isolate the contribution of lane assignment from crew strength.
One dataset assembled from 2018 through 2025 regattas demonstrates that crews assigned the Berkshire station in the first 500 meters recorded faster average splits when stream flow exceeded 0.8 meters per second. The same analysis indicates that crews in the opposite lane closed gaps more effectively during lower flow periods when wind resistance became the dominant variable.
Development of Prediction Models
Statisticians have constructed regression and machine-learning frameworks that incorporate lane history water temperature wind vectors and crew physiological metrics to forecast margins. These models process inputs from past Henley results alongside data from comparable river regattas held in Australia and Canada where similar bend geometries appear.
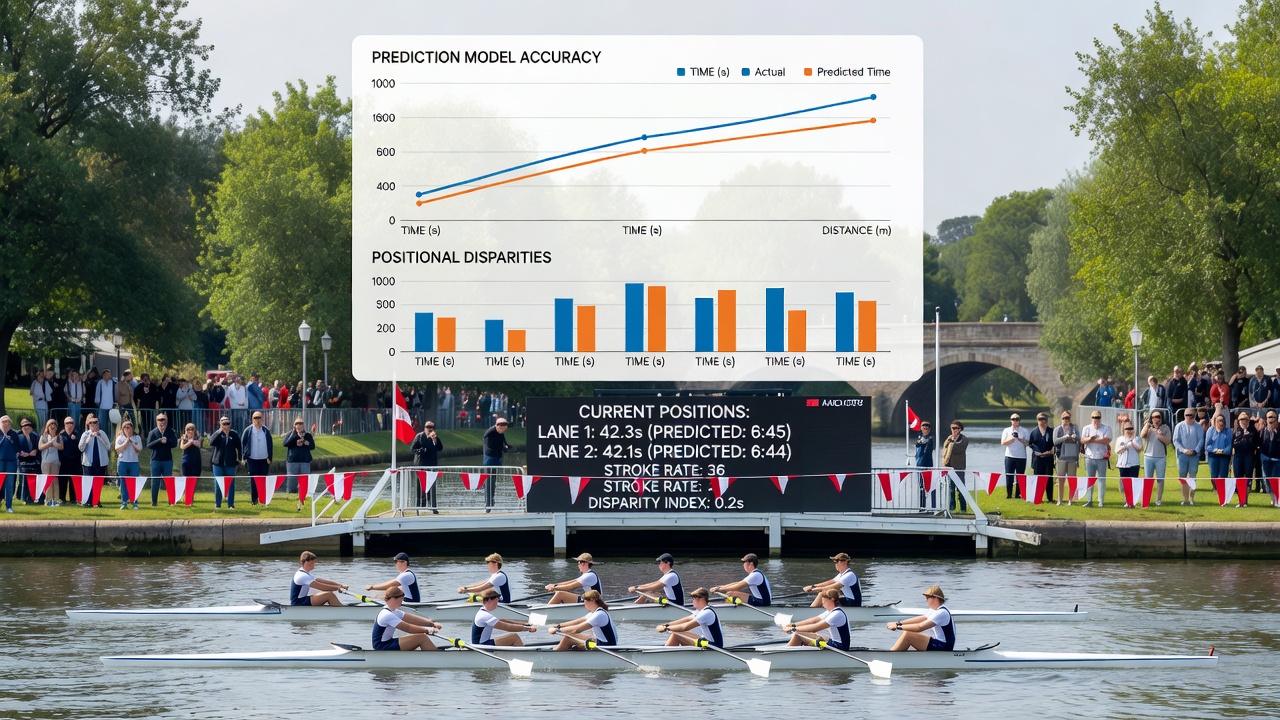
Validation tests conducted on 2024 and 2025 events achieved mean absolute error rates below four seconds for predicted finishing times when at least three prior race observations per crew were available. Accuracy improves further when models receive updated stream velocity readings collected from fixed sensors positioned along the course.
University research groups in New Zealand and the United States have published open-source code that implements these frameworks allowing smaller clubs to run simulations on standard laptops. The code accepts variables such as recent 2000-meter ergometer scores and lane-specific historical margins then outputs probability distributions for each possible finishing order.
Application in June 2026 Preparations
Coaching teams preparing for the 2026 season have begun integrating these tools into selection trials held during late spring. By feeding trial results into the models crews can identify which lane assignments historically produce the largest time penalties and adjust training emphasis accordingly.
World Rowing Federation technical reports note that several national federations now require analysts to present lane-adjusted projections before final crew nominations. This practice reduces the likelihood that a strong crew draws an unfavorable station and underperforms relative to expectations.
Future Refinements and Data Sources
Engineers continue to install additional sensors along the course to capture finer-grained flow data that current models treat as averaged values. Real-time transmission of these readings during racing windows allows on-the-day adjustments to probability estimates and supports more accurate post-race evaluations.
Academic papers hosted by the World Rowing Federation archive detail the sensor calibration methods while a longitudinal study published through the International Journal of Sports Physiology and Performance tracks model performance across five consecutive regatta seasons. Both sources provide the raw inputs required for independent verification of lane-effect estimates.
Conclusion
Position matching combined with predictive modeling supplies organizers and coaches with quantitative tools to interpret results that once appeared random. Continued sensor deployment and expanded datasets will refine these estimates further and allow crews to prepare specifically for the constraints imposed by particular lanes on the historic Henley course.